What is a packet sniffer?
A packet sniffer or network analyzer is a tool that intercepts and captures data packets as they travel over a network. When devices communicate with each other over a network, the information is divided into smaller units called packets.
A packet sniffer “sniffs” or listens to the network traffic and captures these packets.
This guide highlights the best packet sniffing tools on the market helping you to choose from the dozens of options out there.
Here’s our list of the best packet sniffers:
- SolarWinds Deep Packet Inspection and Analysis Tool EDITOR’S CHOICE Gives detailed insights into what causes network slowness and uses deep packet inspection to allow you to resolve the root causes. You can identify traffic by application, category and risk level to eliminate and filter problem traffic. With a great user interface, this excellent packet sniffing tool is perfect for network analysis. Download a 30-day free trial.
- ManageEngine NetFlow Analyzer (FREE TRIAL) A traffic analysis tool that works with NetFlow, J-Flow, sFlow Netstream, IPFIX, and AppFlow. Start a 30-day free trial.
- Paessler Packet Capture Tool (FREE TRIAL) A packet sniffer, a NetFlow sensor, an sFlow sensor, and a J-Flow sensor built into Paessler PRTG. Download a 30-day free trial.
- Omnipeek Network Protocol Analyzer A network monitor that can be extended to capture packets.
- tcpdump The essential free packet capture tool that every network manager needs in his toolkit.
- Windump A free clone of tcpdump written for Windows systems.
- Wireshark A well-known free packet capture and data analysis tool.
- tshark A lightweight answer to those who want the functionality of Wireshark, but the slim profile of tcpdump.
- NetworkMiner A Windows-based network analyzer with a no-frills free version.
- Fiddler A packet capture tool that focuses on HTTP(s) traffic.
- Capsa Written for Windows, the free packet capture tool can be upgraded for payment to add on analytical features.
The best packet sniffers
The tools I’ve listed in this article can be used by experienced network admins who already know what they’re looking for, but aren’t sure which tools are best. They can also be used by more junior sysadmins to gain experience with how modern networks look during day-to-day operations, which will help identify network issues later on.
Our methodology for selecting a packet sniffer
We reviewed the market for packet sniffers and analyzed the options based on the following criteria:
- The ability to read packet headers and identify source and destination addresses
- A protocol analyzer that can categorize traffic by app
- The option to capture all packets or sample every nth packet
- The ability to communicate with switches and routers through NetFlow and other traffic analysis protocol languages
- Capacity planning and traffic shaping tools
- A free trial period or money-back guarantee for no-risk assessment
- A free tool that is worth installing or a paid tool that is worth the price
Almost all of these tools collect in the same way; it’s the analysis that differentiates them.
1. SolarWinds Deep Packet Inspection and Analysis tool (FREE TRIAL)
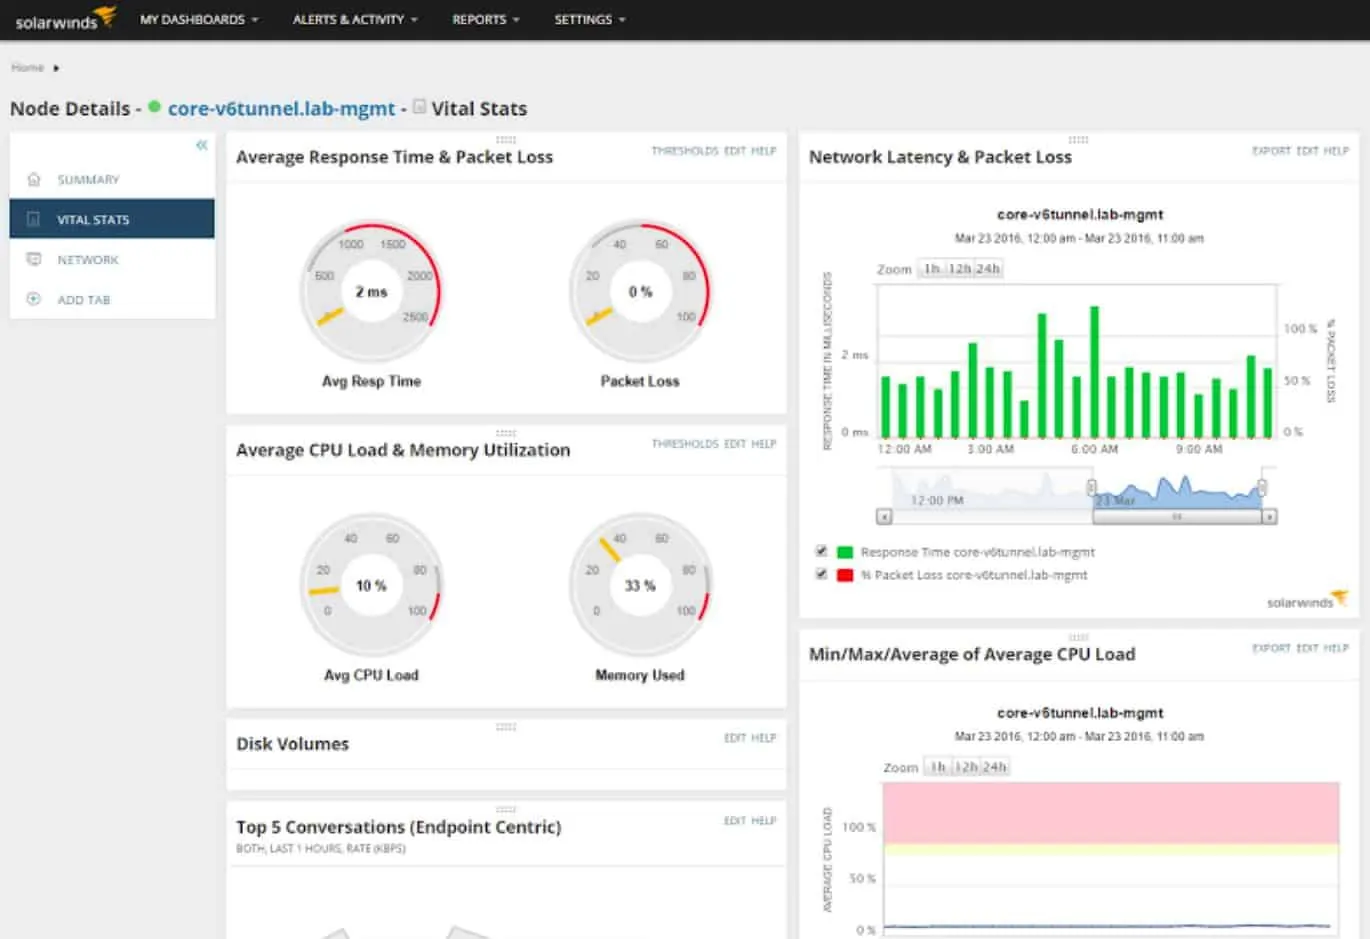
SolarWinds is a comprehensive suite of IT management tools. The tool that is more relevant to this article is the Deep Packet Inspection and Analysis tool.
When we tested Deep Packet Inspection and Analysis tool we found the following key features.
Key Features:
- Network Traffic Categorization: This allows administrators to understand the nature and type of data flowing through the network.
- Protocol Stack Analyzer: It includes a protocol stack analyzer, which enables a detailed examination of the protocol layers in network communications.
- Live Monitoring: Real-time monitoring capabilities provide administrators with immediate insights into ongoing network activities.
- Supports Traffic Shaping: The tool supports traffic shaping, allowing administrators to control and optimize the flow of data within the network.
- 30-Day Free Trial: The software offers a 30-day free trial, allowing users to explore its capabilities before making a purchase.
Why do we recommend it?
The Deep Packet Inspection and Analysis Tool is part of the SolarWinds Network Performance Monitor. This on-premises software package checks on the statuses of network devices with the Simple Network Management Protocol as its main task. So, the DPI system is supplementary to that central function and adds on greater detail of network activity without users having to buy an additional network traffic analyzer. Most of your traffic will have encrypted contents and this DPI system can’t break that confidentiality. However, it reads the unencrypted headers of packets traveling around the network, which provide data on protocols and endpoints involved in network traffic creation.
Collecting network traffic activity is relatively straightforward. Using tools like WireShark, basic level analysis isn’t a show stopper either. But not all situations are that cut and dried. In a bustling network, it may be hard to determine even some fundamental things such as:
- What application on the local network is creating this traffic?
- If the application is known (say, a web browser) where are people spending most of their time?
- Which connections take the longest and are bogging down the network?
Most network devices just use each packet’s metadata to ensure the packet gets where it is going. The contents of the packet are unknown to the network device. Deep Packet Inspection is different; it means that the actual contents of the packet are inspected to learn more about it.
Critical network information that cannot be gleaned from the metadata can be discovered in this way. Tools like those provided by SolarWinds can provide more meaningful data than simply traffic flow.
Other techniques for managing high volume networks include NetFlow and sFlow. Each has its strengths and weaknesses and you can read more about NetFlow and sFlow techniques here.
Network analysis, in general, is an advanced topic that is half experience and half training. It’s possible to train someone to understand every detail about network packets. Still, unless that person also has knowledge of the target network, and some experience to identify anomalies, they won’t get very far.
Who is it recommended for?
The SolarWinds Network Performance Monitor is a great tool for automated monitoring of mid to large networks. It can also be used to centralize the monitoring of multiple networks. There isn’t a free version of this package, so cash-strapped small businesses probably won’t go for it. However, the addition of DPI on top of autodiscovery, network inventory management, and automated monitoring with alerts makes this package very good value for money. You need to have a host running Windows Server to install this package.
During our testing, we identified the following pros and cons related to Network Performance Monitor.
Pros:
- Combines DPI and Analysis Features: The tool combines Deep Packet Inspection (DPI) with robust analysis features, making it a comprehensive solution for detailed troubleshooting and security audits.
- Built for Enterprise: Designed with enterprise needs in mind, the suite provides robust data collection capabilities and offers various options for visualizing and searching collected data.
- Supports NetFlow and sFlow Collection: It supports both NetFlow and sFlow collection, providing flexibility for higher volume networks and compatibility with multiple network devices.
- Visual Clues for Issue Identification: The inclusion of color-coding and other visual clues helps administrators quickly identify issues, enabling efficient troubleshooting without the need for in-depth analysis initially.
Cons:
- Advanced Tool: The tool is highly advanced and tailored for network professionals, making it less suitable for home users or hobbyists who may not require the full range of features and complexity offered.
EDITOR'S CHOICE
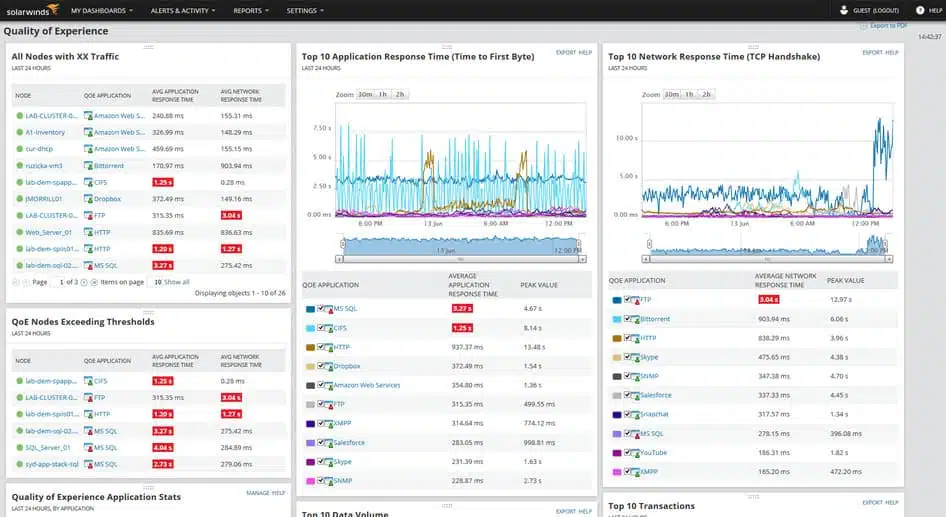
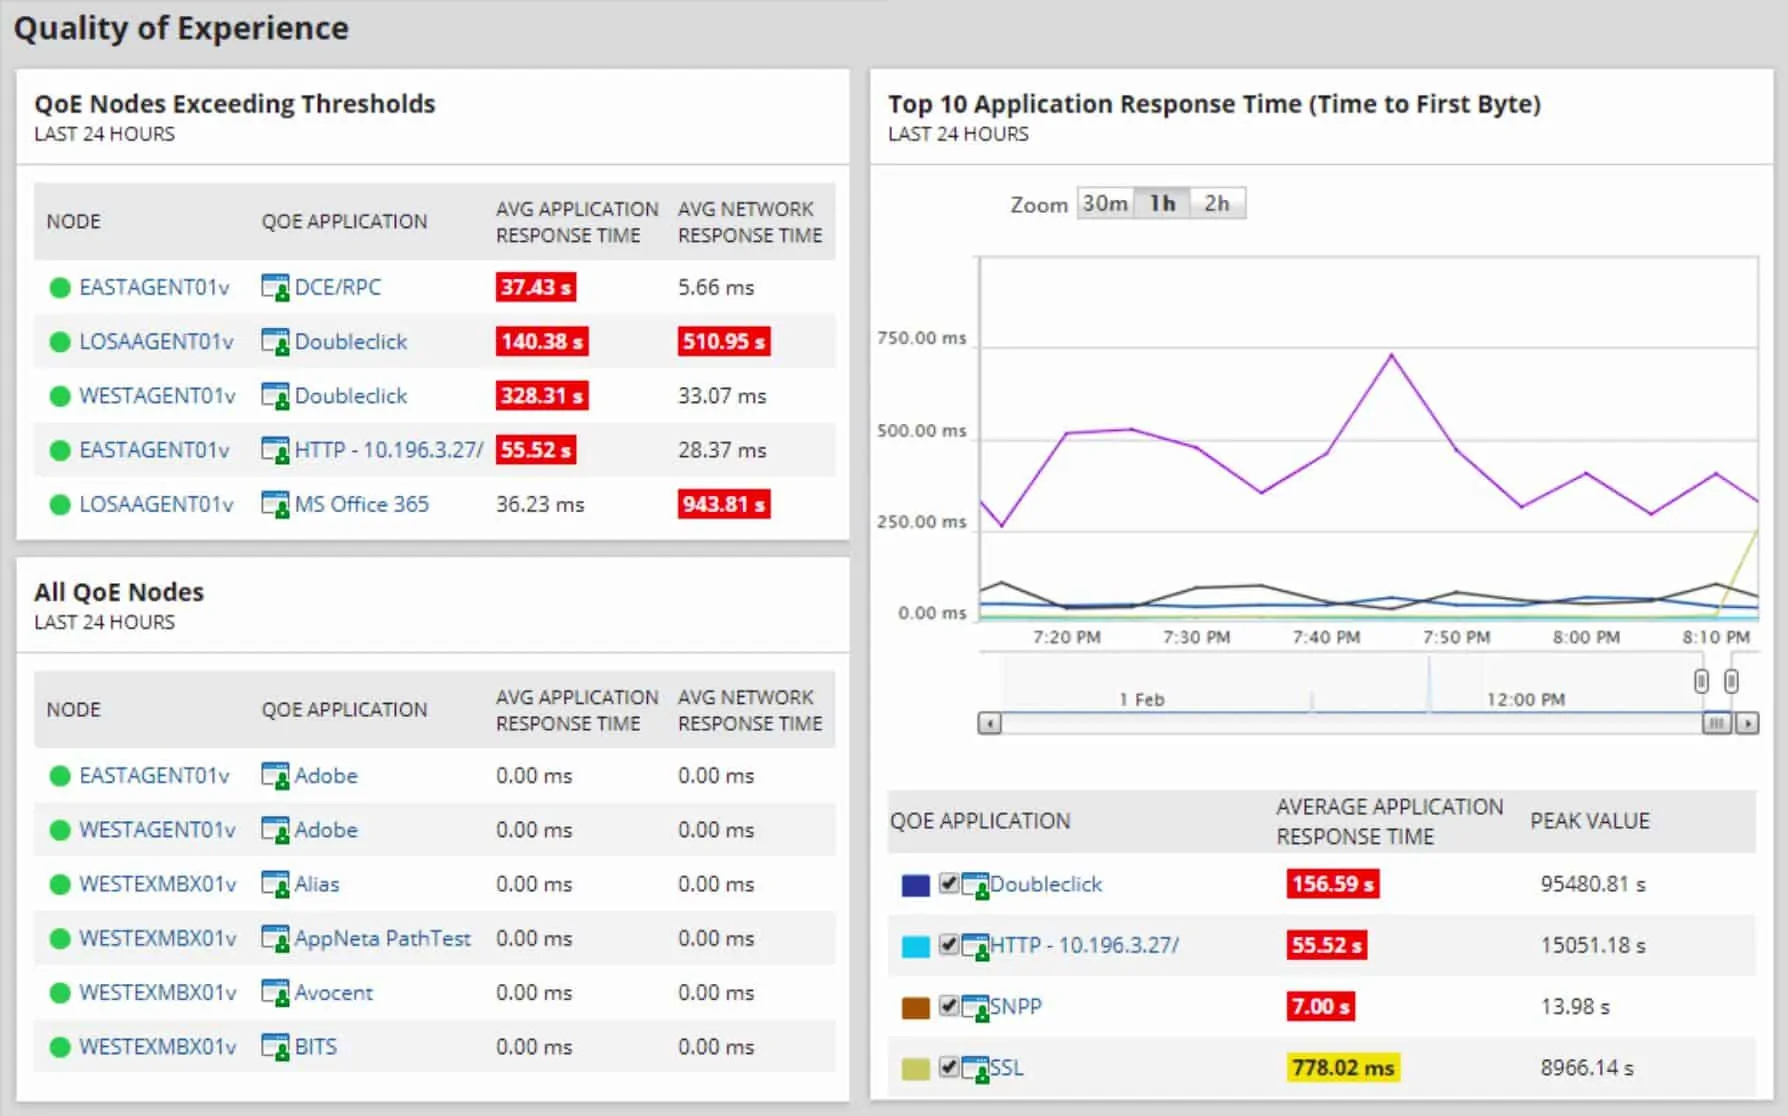
SolarWinds Network Performance Monitor is our Editor’s Choice because it gives detailed insights into what causes network slowness and allows you to quickly resolve the root causes using deep packet inspection. By identifying traffic by application, category (business vs. social) and risk level you can eliminate and filter problem traffic and measure application response time. With a great user interface, this excellent packet sniffing software is perfect for network analysis.
Get 30 Day Free Trial: www.solarwinds.com/topics/deep-packet-inspection/
OS: Microsoft Windows Server 2016 & 2019
You can enhance your ability to examine packets by adding on the NetFlow Traffic Analyzer. This module includes a packet sniffer and also flow protocols, such as NetFlow and IPFIX. You can get the pair of tools together in the Network Bandwidth Analyzer Pack.
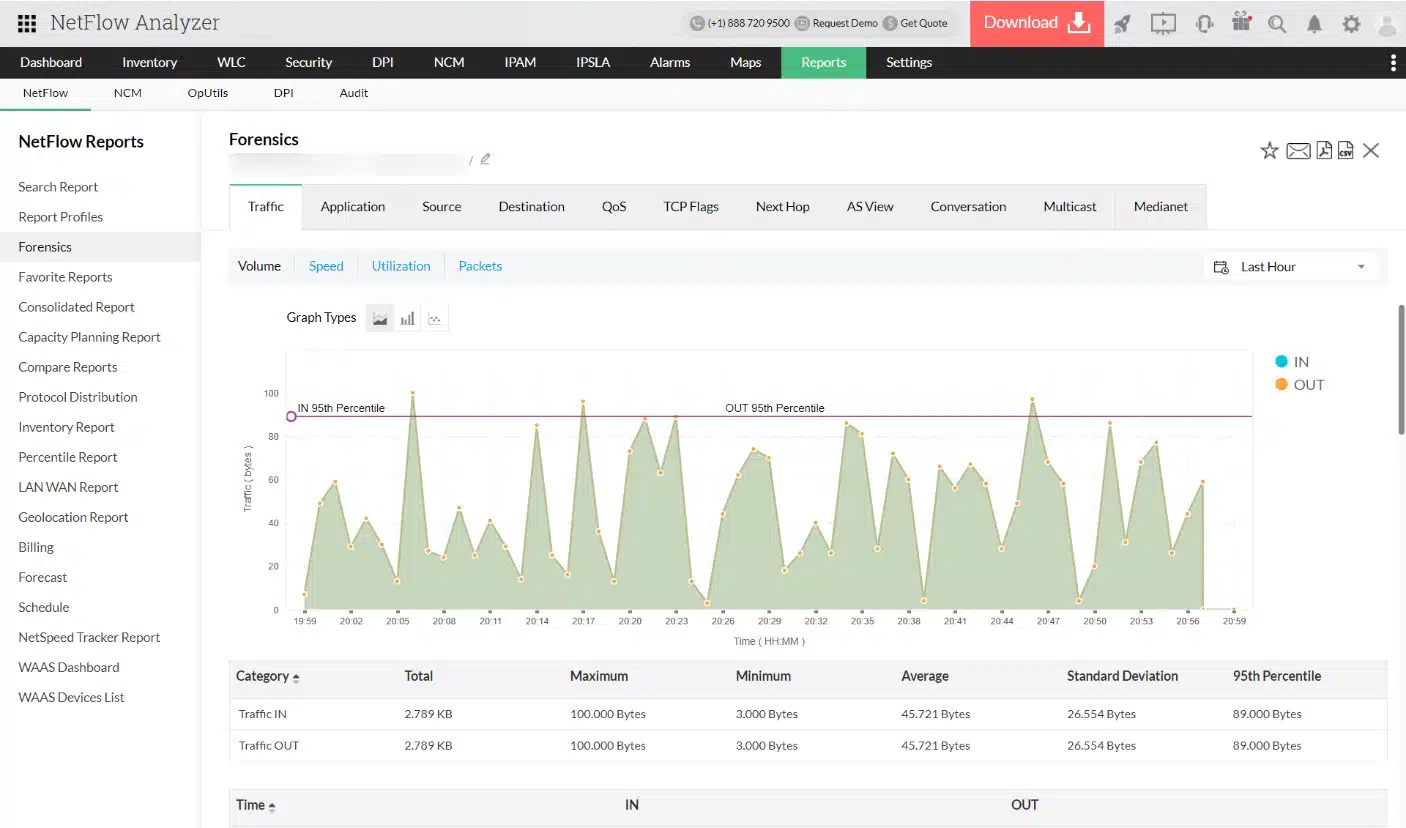
2. ManageEngine NetFlow Analyzer (FREE TRIAL)
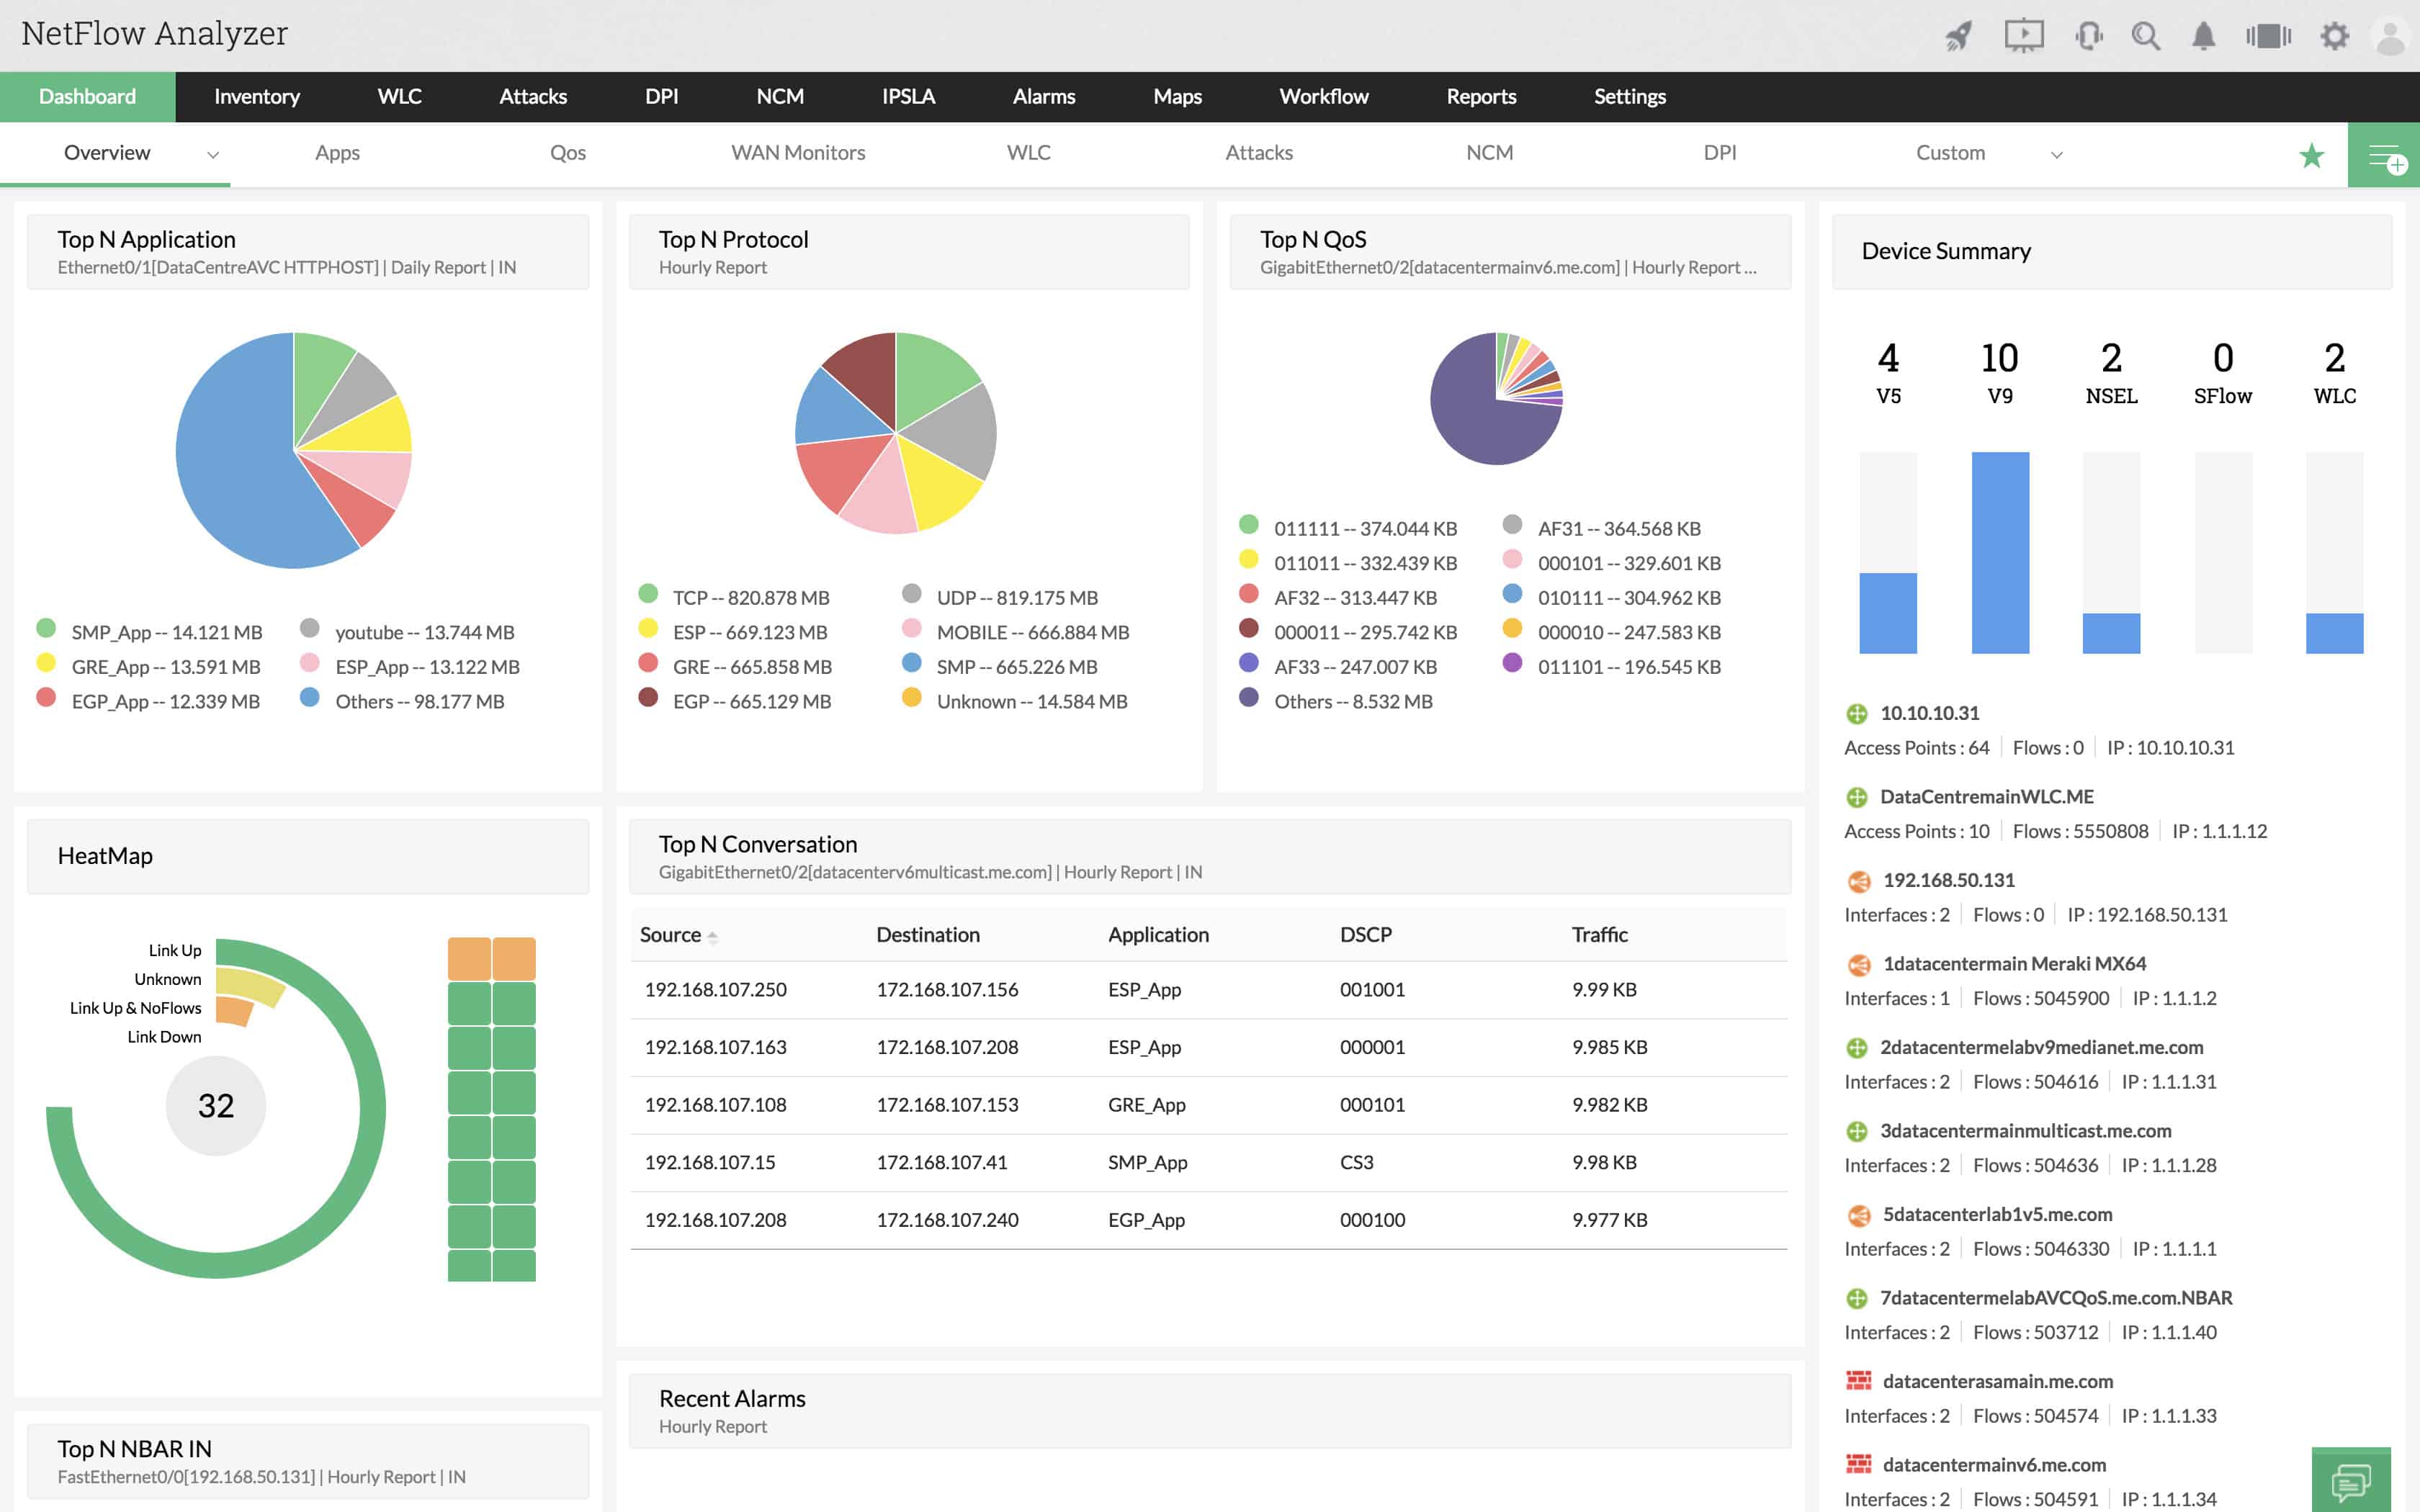 The ManageEngine NetFlow Analyzer takes traffic information from your network devices. You can choose to sample traffic, capture entire streams, or gather statistics on traffic patterns with this tool.
When we tested NetFlow Analyzer we found the following key features.
Key Features:
- SNMP-Based: Utilizes SNMP for data collection, allowing for efficient monitoring of network devices.
- Traffic Shaping: Offers traffic shaping capabilities, enabling administrators to control and optimize data flow within the network.
- Support for Multiple Protocols: Supports various network flow protocols, including NetFlow, IPFIX, sFlow, J-Flow, NetStream, and AppFlow, ensuring compatibility with a wide range of network devices.
- Excellent User Interface: Boasts an excellent user interface that is easy to navigate, even on high-volume networks, maintaining clarity and usability for administrators.
Why do we recommend it?
ManageEngine NetFlow Analyzer is a traffic monitoring tool that mainly uses network device query languages, such as NetFlow, sFlow, and J-Flow. These systems analyze packets and store statistics related to packet header values within the switch or router. So, when the ManageEngine monitor queries that information, it is retrieving data that was derived from packet inspection. Packet capture can take up a lot of space on a hard drive because a typical network processes a very large volume of traffic. So, just extracting statistics about packet headers gives you a more efficient method of conducting protocol analysis.
The makers of network devices don’t all use the same protocol for communicating traffic data. Thus, the NetFlow Analyzer is capable of using different languages to gather information. These include Cisco NetFlow, Juniper Networks J-Flow, and Huawei Netstream. It is also capable of communicating with the sFlow, IPFIX, and AppFlow standards.
The monitor is able to track the consistency of data flows as well as the load on each network device. Traffic analysis capabilities let you see packets as they pass through a device and capture them to file. This visibility will enable you to see which network applications are chewing up most of your bandwidth and take decisions over traffic shaping measures, such as priority queuing or throttling.
The dashboard of the system features color-coded graphics, which make your task of spotting problems a lot easier. The attractive look and feel of the console ties in with other ManageEngine infrastructure monitoring tools because they were all built on a common platform. This makes it integrate with several ManageEngine products. For example, it is very common for network administrators to buy both the OpManager and the NetFlow Analyzer from Manage Engine.
OpManager monitors devices’ statuses with SNMP procedures, while NetFlow Analyzer focuses on traffic levels and packet flow patterns.
ManageEngine NetFlow Analyzer installs on Windows, Windows Server, and RHEL, CentOS, Fedora, Debian, SUSE, and Ubuntu Linux. The system is offered in two editions.
The Essential edition gives you the standard network traffic monitoring functions plus a reporting and billing module. The higher plan is called the Enterprise Edition. This has all of the features of the Essential Edition plus NBAR & CBQoS monitoring, an advanced security analytics module, capacity planning utilities, and deep packet inspection capabilities. This Edition also includes IP SLA and WLC monitoring.
Who is it recommended for?
Any network administrator that needs to analyze traffic and try to get the best value for money out of current hardware would benefit from this package. The tool is also able to assist in implementing traffic shaping measures that ensure your time-critical traffic gets delivered speedily without having to buy extra capacity. This system is available in a free edition but that will only give you data extraction from two interfaces, which isn’t much use. There is a version of the software that will analyze a single network and another that can monitor a WAN. You need to install and manage the software for the NetFlow Analyzer and it will run on Windows Server or Linux. You can also get it on an AWS account.
During our testing, we identified the following pros and cons related to NetFlow Analyzer.
Pros:
- Pre-Built Templates: Provides pre-built templates that allow users to quickly extract insights from packet captures, streamlining the analysis process.
- Cross-Platform Compatibility: Installs on both Windows and various flavors of Linux, offering flexibility in terms of the operating system.
- Enterprise Focus: Built with enterprise needs in mind, offering SLA tracking and monitoring features, making it suitable for organizations processing significant data volumes.
Cons:
- Enterprise-Centric: Tailored for enterprise-level companies dealing with substantial data processing, making it less ideal for small LANs or home users with simpler network setups.
You can get either edition of the NetFlow Analyzer on a 30-day free trial.
3. Paessler Packet Capture Tool (FREE TRIAL)
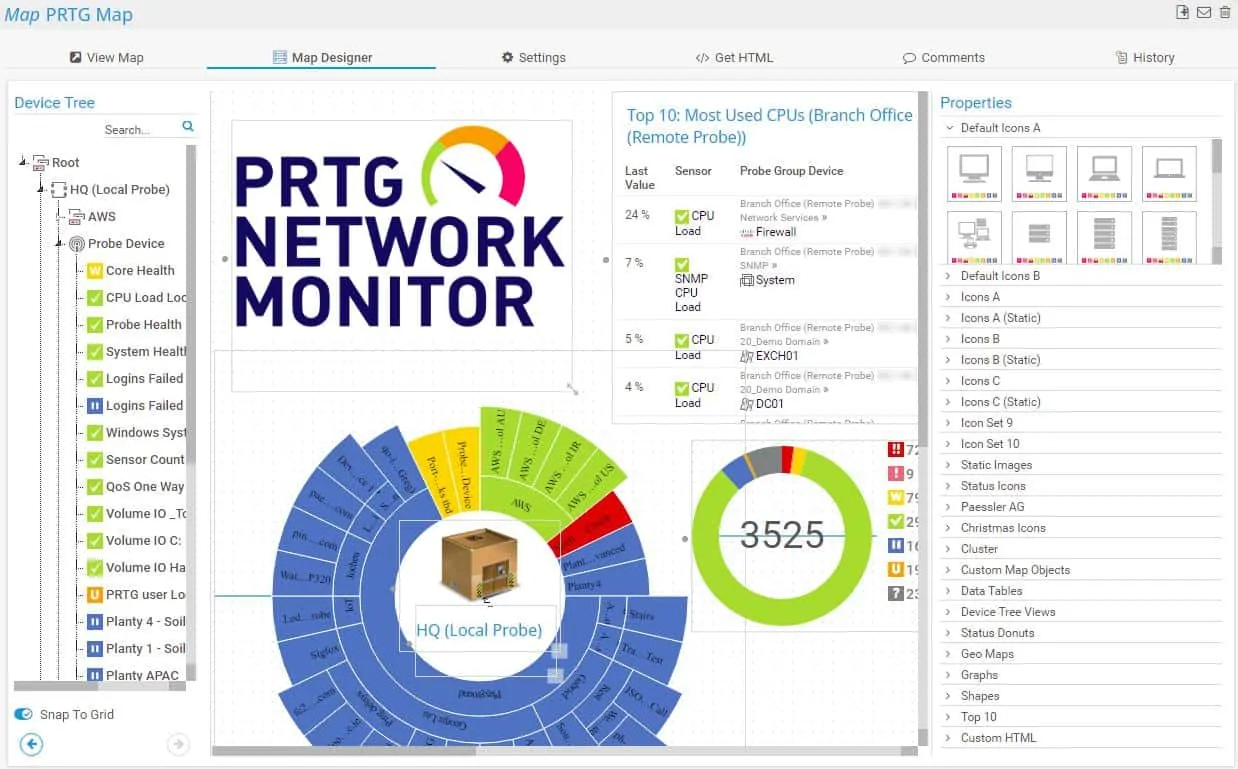
The Paessler Packet-Capture-Tool PRTG: All-In-One-Monitoring is a unified infrastructure monitoring tool. It helps you manage your network and your servers. The network monitoring segment of the utility covers two types of tasks. These are a network performance monitor, which examines the statuses of network devices and a network bandwidth analyzer, which covers the flow of traffic over links in the network.
When we tested PRTG: All-In-One-Monitoring we found the following key features.
Key Features:
- Support for Multiple Sensor Types: Supports various sensor types such as NetFlow, sFlow, and J-Flow, ensuring compatibility with different network devices and protocols.
- Live Traffic Graphs: Offers live traffic graphs, allowing administrators to visualize network activity in real-time.
- Performance Troubleshooting: Equipped with features specifically designed for performance troubleshooting, enabling users to identify and resolve network issues efficiently.
- Traffic Alerts: Provides traffic alerts, notifying administrators of any abnormal or suspicious network activity.
Why do we recommend it?
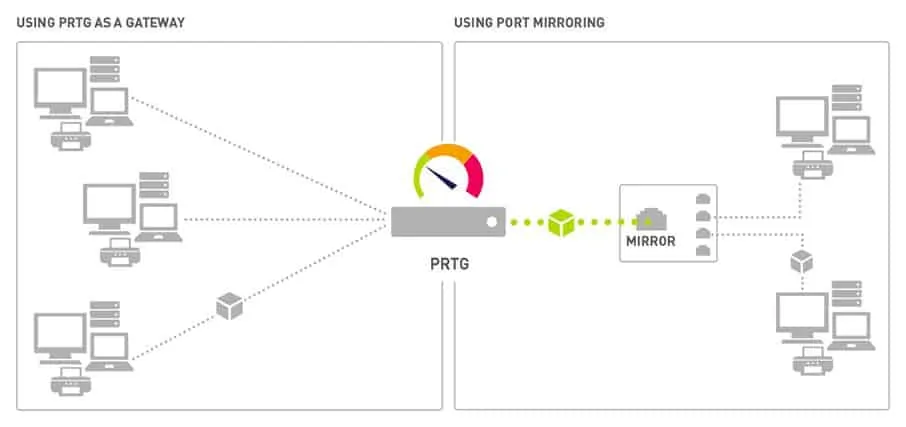
The Paessler Packet Capture Tool is part of the PRTG bundle. This is a collection of “sensors” – each of which is an individual monitoring system. The tool offers value for money because you can just add it on to the full network performance monitor, which is driven by the Simple Network Management Protocol. The PRTG bundle also offers NetFlow, sFlow, and J-Flow sensors. You probably won’t need to activate all of those options. Combining one or two of these sensors with the packet capture sensor for ad-hoc investigations and referring to the live network map that PRTG provides gives you great support for traffic management.
The bandwidth analysis part of PRTG is implemented through the use of four different packet capture tools. These are:
A packet sniffer
A NetFlow sensor
An sFlow sensor
A J-Flow sensor
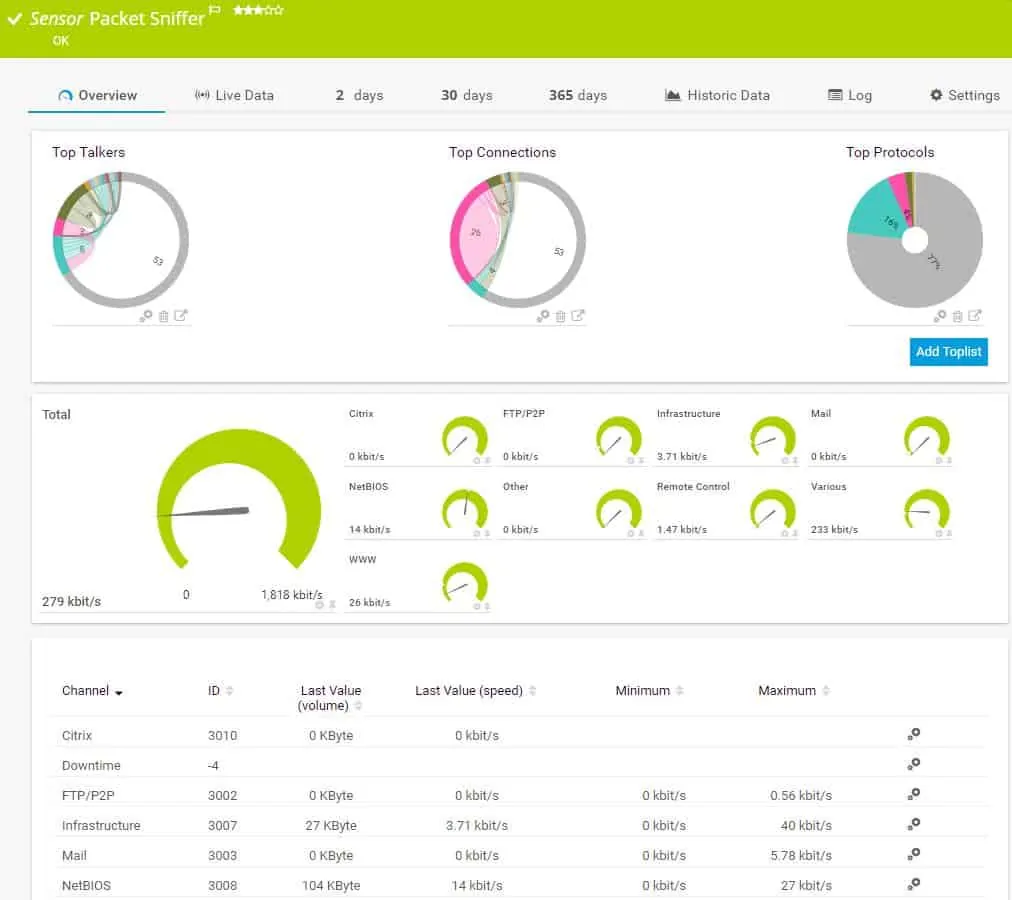
The PRTG packet sniffer only captures the headers of the packets traveling across your network. This gives the packet analyzer a speed advantage and it also reduces the amount of storage space needed to hold capture files. The dashboard of the packet sniffer categorizes traffic by application type. These include email traffic, web packets, chat app traffic data, and file transfer packet volumes.
NetFlow is a very widely used data flow messaging system. It was created by Cisco Systems but it is also used for equipment produced by other manufacturers. The PRTG NetFlow sensor also picks up IPFIX messages — this messaging standard is an IETF-sponsored successor to NetFlow. The J-Flow method is a similar messaging system used by Juniper Networks for its equipment. The sFlow standard samples traffic flows, so it will collect every nth packet. NetFlow and J-Flow both capture continuous streams of packets.
Paessler prices its PRTG software on the number of “sensors” that an implementation activates. A sensor is a system condition or hardware component. For example, each of the four packet sniffers offered by Paessler counts as one PRTG sensor. The system is free to use if you activate 100 sensors or less, so if you only use this package for its packet sniffing interfaces, you won’t have to pay Paessler anything.
Who is it recommended for?
PRTG is a very big package but you can choose to tailor it by only activating a limited number of sensors. This makes the system very accessible for businesses of all sizes and it also comes with the capability to monitor multiple networks from one console. Small businesses are able to use this system at no cost because it is free forever if you only activate 100 sensors. The software package installs on Windows Server but PRTG is now also available as a SaaS package on the cloud.
During our testing, we identified the following pros and cons related to PRTG: All-In-One-Monitoring.
Pros:
- Customizable Sensors: Allows users to customize sensors based on the specific application or server they are testing, providing flexibility in monitoring tailored to their needs.
- Packet Header Capture: Captures packet headers only, which accelerates analysis and helps reduce storage costs for long-term data collection.
- Intuitive Graphing: Utilizes simple yet intuitive graphing for traffic visualization, making it easy for administrators to interpret network data.
Cons:
- Learning Curve: The platform offers a wealth of features and functionalities, but its depth and complexity may require a learning curve for users to fully utilize all available capabilities.
The Paessler system includes many other network and server monitoring capabilities including a virtualization monitor and an application monitor. PRTG can be installed on-premises or you can access it as a cloud service. The software runs on Windows environments and you can get it on a 30-day free trial.
4. Omnipeek Network Protocol Analyzer

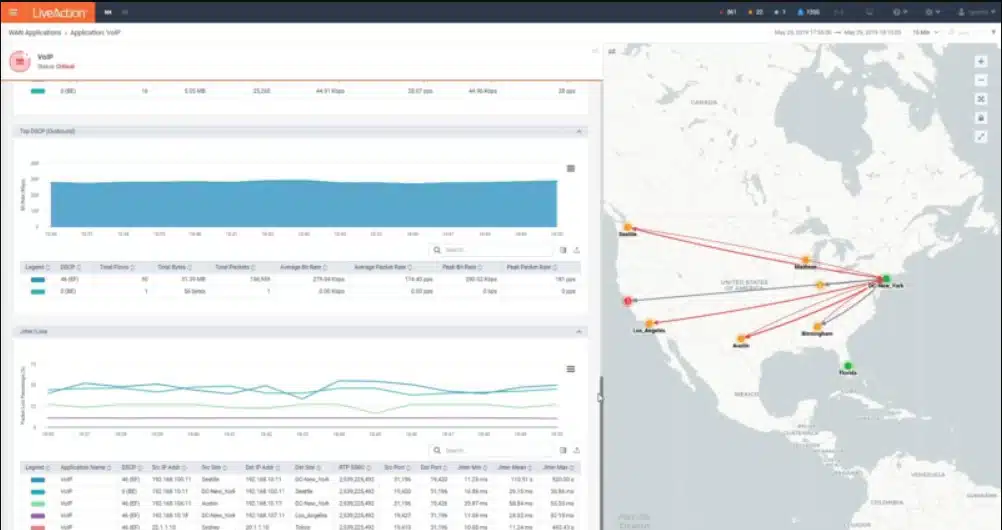
LiveAction Omnipeek, previously a product of Savvius, is a network protocol analyzer that can be used to capture packets as well as produce protocol analysis of network traffic.
When we tested Omnipeek we found the following key features.
Key Features:
- Protocol Analyzer: Omnipeek functions as a protocol analyzer, allowing users to analyze and interpret network protocols for troubleshooting and optimization.
- Packet Capture Tool: Equipped with packet capture tools, enabling users to capture and inspect network traffic for diagnostic and monitoring purposes.
- Wireless Network Support: Extends its capabilities to analyze wireless networks, making it versatile for both wired and wireless network environments.
Why do we recommend it?
Omnipeek Protocol Analyzer will sample passing packets on a specific network device, compiling statistics on traffic source, destination, and protocol. The service can also be set to capture packets for viewing. However, you would only be interested in looking at packet headers for analysis and the Omnipeek does that for you in its default settings. The Omnipeek Protocol Analyzer will also sample traffic on wireless networks. This system can be set up to provide traffic analysis for all network traffic or just that traffic intended for one specific device interface – so you can examine a specific link.
Omnipeek can be extended by plug-ins. The core Omnipeek system doesn’t capture network packets. However, the addition of the Capture Engine plug-in gets the packet capture function. The Capture Engine system picks up packets on a wired network; another extension, called Wifi Adapter adds wireless capabilities and enables Wifi packets to be captured through Omnipeek.
The functions of the base Omnipeek Network Protocol Analyzer extend to network performance monitoring. As well as listing traffic by protocol, the software will measure the transfer speed and regularity of traffic, raising alerts if traffic slows down or trips passed boundary conditions set by the network administrator.
The traffic analyzer can track end-to-end transfer performance across an entire network, or just monitor each link. Other functions monitor interfaces, including incoming traffic arriving at web servers from outside the network. The software is particularly interested in traffic throughput and a display of traffic per protocol. Data can be viewed as lists of protocols and their throughput or as live graphs and charts. Packets captured with the Capture Engine can be stored for analysis or replayed across the network for capacity testing.
Who is it recommended for?
Omnipeek can be used for traffic investigations if you want to see which system or user is generating the most load on the network. IT can also be used as a live network performance monitor because you can set up data throughput expectation thresholds that will trigger alerts if crossed. This is an on-premises package for Windows.
During our testing, we identified the following pros and cons related to Omnipeek.
Pros:
- Lightweight Installation: Omnipeek offers a lightweight installation, ensuring that the tool does not impose significant resource requirements on the system.
- Packet Replay for Testing: This allows users to replay captured packets for testing and capacity planning, aiding in simulating and analyzing network scenarios.
Cons:
- Interface Improvement Needed: Some users have noted that the interface, especially around the toolbar section, could be improved. This suggests that the user interface might not be as intuitive or user-friendly as desired.
Omnipeek installs on Windows and Windows Server. The system isn’t free to use. However, it is possible to get Omnipeek on a 30-day free trial.
5. tcpdump
The fundamental tool of almost all network traffic collection is tcpdump. It is an open-source application that comes installed on almost all Unix-like operating systems. Tcpdump is an excellent collection tool and comes complete with a very complex filtering language. It’s essential to know how to filter the data at collection time to end up with a manageable chunk of data to analyze. Capturing all data from a network device on even a moderately busy network can create too much data to analyze efficiently.
When we tested tcpdump we found the following key features.
Key Features:
- Command-Line Tool: tcpdump is a command-line-based tool, which means it is operated through the command line interface (CLI) rather than a graphical user interface (GUI).
- Packet Capture: Primarily used for packet capture, tcpdump allows users to capture and analyze network traffic.
- Completely Free: tcpdump is completely free to use, making it an accessible option for users with budget constraints.
Why do we recommend it?
The tcpdump system has been in circulation for a very long time. This is the classic network packet capture tool that was originally written for Unix. You can just display packets on the screen, but it is more usual to write to file. Although you can impose some command line filters on the output, either for display on the screen to reduce the amount of traffic that goes to a file, this is a raw capture tool. You won’t want to leave this system running for too long because it will generate very large files.
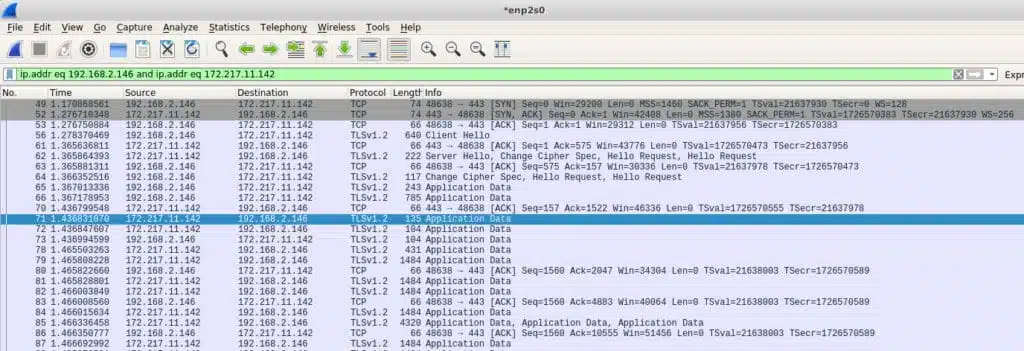
In some rare cases, allowing tcpdump to output its capture directly to your screen may be enough to find what you’re looking for. For example, in writing this article, I captured some traffic and noticed that my machine was sending traffic to an IP address I did not recognize. It turns out that my machine was sending data to a Google IP address of 172.217.11.142. Since I did not have any Google products running, nor Gmail open, I did not know why this was happening. I examined my system and found this:
[ ~ ]$ ps -ef | grep google
user      1985  1881  0 10:16 ?        00:00:00 /opt/google/chrome/chrome --type=service
It seems that even when Chrome is not running in the foreground it remains running as a service. I would not have necessarily noticed this without a packet analysis to tip me off. I re-captured some more tcpdump data but this time told tcpdump to write the data to a file that I opened in Wireshark (more on that later). Here’s that entry:
Tcpdump is a favorite tool among sysadmins because it is a command-line tool. This means that it doesn’t require a full-blown desktop to run. It is unusual for production servers to provide a desktop because of the resources that would take, so command-line tools are preferred. As with many advanced tools, tcpdump has a very rich and arcane language that takes some time to master.
Who is it recommended for?
The tcpdump system is a little dated as an analysis tool – you can use GUI tools for easier analysis. However, it is a very useful “nuts and bolts” packet sniffer. You can use tcpdump for free but there isn’t a version for Windows. There are some clones available that third parties have created for use on Windows – see below for one example.
During our testing, we identified the following pros and cons related to tcpdump.
Pros:
- Open-Source: Being an open-source tool, tcpdump is backed by a large and dedicated community. This ensures ongoing development, support, and a wealth of resources for users.
- Lightweight CLI Application: tcpdump is a lightweight application that operates through the command line, making it resource-efficient and suitable for use in various environments.
Cons:
- Less User-Friendly: One of the drawbacks of tcpdump is its lack of a graphical user interface, making it less user-friendly compared to tools with GUIs. Users need to be comfortable with command-line interactions.
- Complicated Query Language: tcpdump uses a complicated query language for filtering network traffic, which can be challenging for users unfamiliar with its syntax.
- Packet Capture Format: The captured packets are stored in pcap file format. While pcap files are widely supported in various network analysis tools, the limitation is that the packet capture can only be read by applications that can interpret pcap files, not in plain text files.
A few of the very basic commands involve selecting the network interface from which to collect data, and writing that data to a file so it can be exported for analysis elsewhere. The -i and -w switches are used for this.
# tcpdump -i eth0 -w tcpdump_packets
tcpdump: listening on eth0, link-type EN10MB (Ethernet), capture size 262144 bytes
^C51 packets captured
This produces a capture file:
file tcpdump_packets
tcpdump_packets: tcpdump capture file (little-endian) - version 2.4 (Ethernet, capture length 262144)
The standard TCP capture file is a pcap file. It is not text so it can only be read by an analysis program that knows how to read pcap files.
6. WinDump
Most useful open source tools are eventually cloned to other operating systems. When this happens, the application is said to have been ported over. WinDump is a port of tcpdump and behaves in very similar ways.
When we tested WinDump we found the following key features.
Key Features:
- Tcpdump for Windows: WinDump is essentially Tcpdump adapted for Windows, bringing packet capture functionality to Windows-based systems.
- Works with WinPcap: Utilizes WinPcap, a Windows packet capture library, to capture and analyze network traffic.
- Free to Use: WinDump is an open-source tool and is freely available for use on Windows systems.
Why do we recommend it?
WinDump is one of the adaptations available to get tcpdump on Windows. This is probably the most well known option for packet sniffing on Windows but it isn’t the only one available. The program relies on WinPcap, but so do many other packet detection systems, such as Wireshark. So, once you install WinPcap you will have a number of packet sniffing options for Windows.
One major difference between WinDump and tcpdump is that Windump needs the WinpCap library installed prior to being able to run WinDump. Despite both WinDump and WinpCap being provided by the same maintainer, they are separate downloads.
WinpCap is an actual library that needs to be installed. But, once it is installed, WinDump is an .exe file that needs no installation so it can just run. That may be something to keep in mind if you’re running a Windows network. You don’t necessarily need WinDump installed on every machine since you can just copy it over as needed, but you will want WinpCap installed to support WinDump.
As with tcpdump, WinDump can output network data to the screen for analysis, be filtered in the same way, and also write data to a pcap file for analysis offsite.
Who is it recommended for?
WinDump is for network administrators who only have Windows PCs to work on and don’t have the option of using tcpdump. As with tcpdump, WinDump is not such a good choice for packet analysis. We found that you would be better off storing packets to a file and then searching through them with a better analysis tool. As it is free to use, WinDump is an appealing little utility to have installed just in case.
During our testing, we identified the following pros and cons related to WinDump.
Pros:
- Open-Source: WinDump is an open-source tool that closely resembles Tcpdump in terms of both interface and functionality. Users familiar with Tcpdump will find a similar experience with WinDump.
- Executable Run with No Lengthy Installations: Runs as an executable, eliminating the need for lengthy installations. This makes it a convenient and portable option for users who prefer simplicity.
- Large Supportive Community: Being open-source, WinDump benefits from a large and supportive community, ensuring ongoing development and a wealth of resources for users.
Cons:
- Less User-Friendly: Like Tcpdump, WinDump lacks a graphical user interface, making it less user-friendly for those who prefer GUI-based tools. Command-line interaction is required.
- WinPcap Library Dependency: WinDump requires the installation of the WinPcap library on Windows systems to function properly. This dependency might be considered a drawback, especially for users who prefer standalone tools.
- Complicated Query Language: Similar to Tcpdump, WinDump employs a complicated query language for filtering network traffic. Users need to familiarize themselves with this syntax for effective use.
7. Wireshark
Wireshark is probably the next best-known tool in any sysadmin’s toolkit. It can not only capture data, but also provides some advanced analysis tools. Adding to its appeal, Wireshark is open source, and has been ported over to almost every server operating system that exists. Starting life named Ethereal, Wireshark now runs everywhere, including as a standalone portable app.
When we tested Wireshark we found the following key features.
Key Features:
- Essential Tool for Networks: Wireshark is considered an essential tool for network analysis, providing detailed insights into network communications.
- Query Language: Wireshark includes a powerful query language for filtering and analyzing captured network data.
- Integrated Packet Collection and Analysis: Wireshark integrates both packet collection and analysis within the same program, offering a comprehensive solution for network professionals.
- Free to Use: Wireshark is an open-source project and is freely available for use.
Why do we recommend it?
Wireshark is a much better packet analyzer than the WinDump/tcpdump option. This system can identify multiple networks and capture traffic from one at a time. You can filter packets during detection and then examine the collected packets with the same query language. The Wireshark tool is able to show you packets live and you can then choose to store those to a file. Packets can be read in from a file for analysis as well. The service automatically color-codes packets and it will also let you step through a conversation, which makes the full examination of the many packets that go into forging a connection much easier to detect.
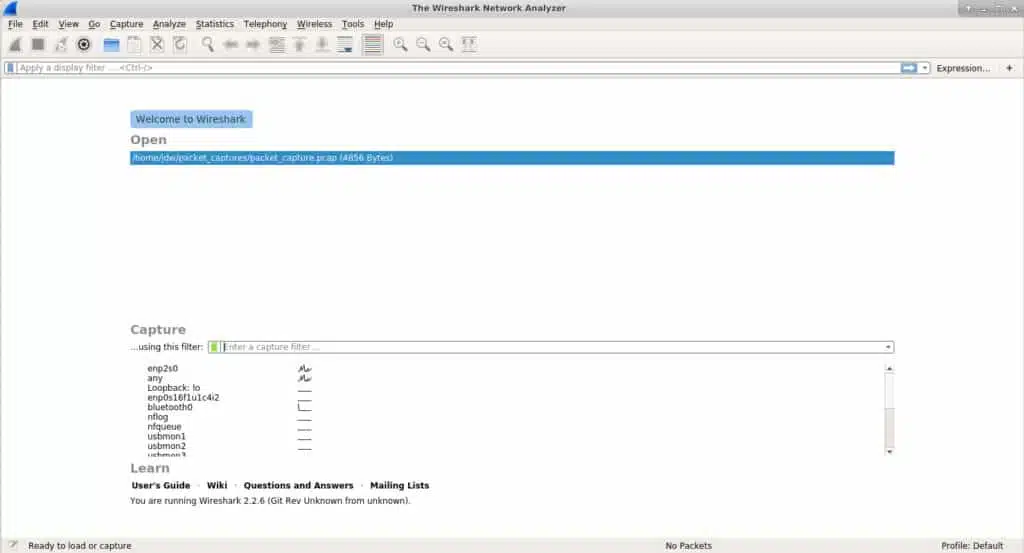
If you’re analyzing traffic on a server with a desktop installed, Wireshark can do it all for you. The collected packets can then be analyzed all in one spot. However, desktops are not common on servers, so in many cases, you’ll want to capture the network data packets remotely and then pull the resulting pcap file into Wireshark.
At first launch, Wireshark allows you to either load an existing pcap file, or start capturing. If you elect to capture network traffic, you can optionally specify filters to pare down the amount of data Wireshark collects. Since its analysis tools are so good, it’s less important to ensure you surgically identify the data at collection time with Wireshark. If you don’t specify a filter, Wireshark will simply collect all network data that your selected interface observes.
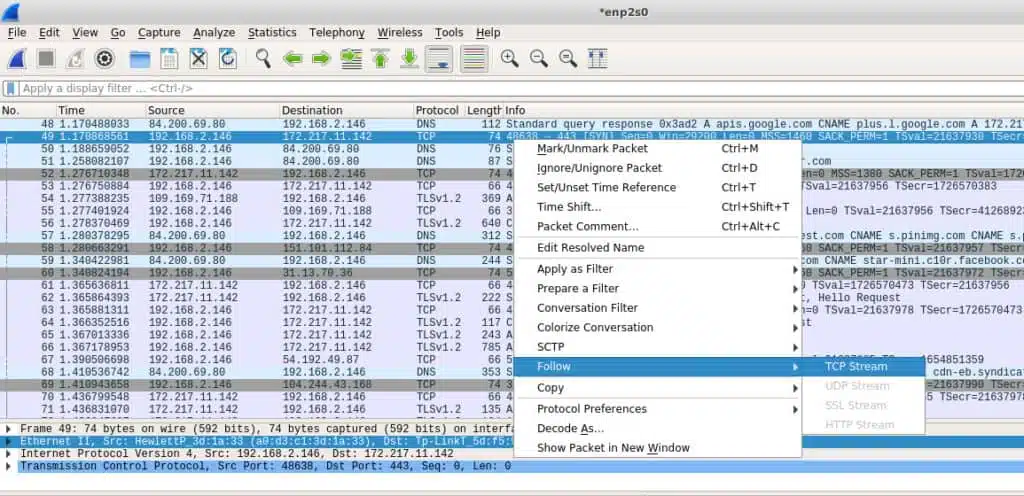
One of the most useful tools Wireshark provides is the ability to follow a stream. It’s probably most useful to think of a stream as an entire conversation. In the screenshot below we can see a lot of data has been captured, but what I am most interested in is that Google IP address. I can right-click it and Follow the TCP Stream to see the entire conversation.
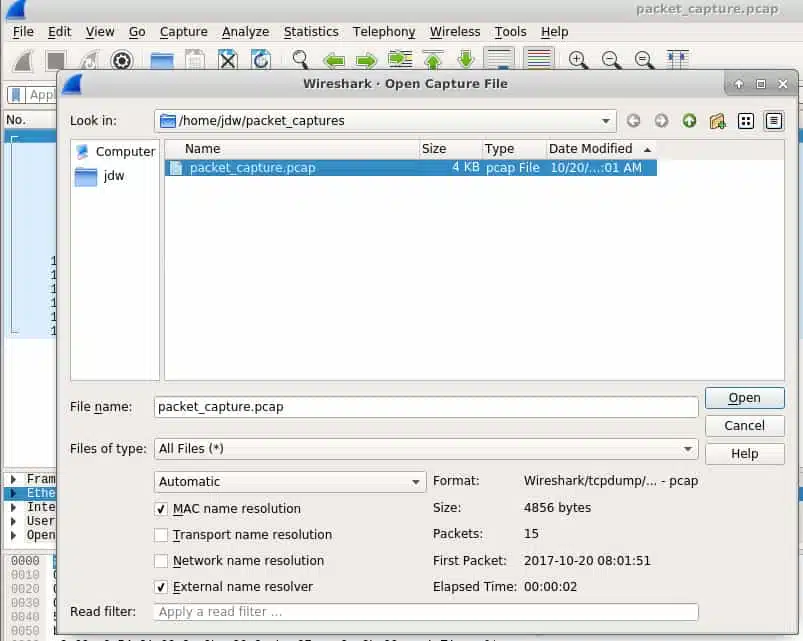
If you’ve captured traffic elsewhere, you can import the pcap file using Wireshark’s File -> Open dialogue. The same filters and tools that can be used for natively captured network data are available for imported files.
Who is it recommended for?
Students of network technology get taught how to use Wireshark. So, your first contact with this system will be during your training. Fortunately, the package is free to use. Once you have become familiar with the use of Wireshark, you will want to have it installed on your device for ad-hoc investigations. Everyone involved in network management probably already knows that they need Wireshark, and probably already has it.
During our testing, we identified the following pros and cons related to Wireshark.
Pros:
- Popular Sniffer Tool with a Massive Community: Wireshark is one of the most popular network sniffer tools, backed by a large and active community. This community support ensures ongoing development, troubleshooting, and the availability of resources for users.
- Open-Source Project with Plugins: Being an open-source project, Wireshark encourages community contributions and supports the addition of new features and plugins, enhancing its functionality.
Cons:
- Steep Learning Curve: Wireshark is designed for network professionals and, as such, has a steep learning curve. Users need a good understanding of networking concepts to fully utilize its capabilities.
- Complex Filtering: Filtering in Wireshark can be complex, and it may take time for users to learn and effectively use its filtering capabilities. The tool collects everything by default, which can be overwhelming on large networks.
8. TShark
TShark is a handy cross between tcpdump and Wireshark. Tcpdump excels at collecting data packets and can very surgically extract only the data you want, however it is limited in how helpful it can be for analysis. Wireshark does a great job at both collection and analysis, but since it has a heavy user interface, it can’t be used on headless servers. Enter TShark; it captures and analyzes but does the latter on the command line.
When we tested TShark we found the following key features.
Key Features:
- Command-Line Interface: TShark is a command-line-based tool, offering a text-based interface for capturing and analyzing network traffic.
- Based on Wireshark: TShark is built on the foundation of Wireshark, inheriting many of its features and capabilities.
- Free to Use: TShark is an open-source project and is freely available for use.
Why do we recommend it?
TShark is the command line version of Wireshark. It is a useful option if you want to put scripts together to search through packet data live and discard the packets. This removes the need to store large amounts of data. You can select specific information, collate statistics, and write your own traffic monitoring system. The Wireshark system has its own quirky query language that takes a long time to learn. However, if you master it, switching over to TShark can make your queries automated and provide a method to create alerts and set up orchestration between applications.
TShark uses the same filtering conventions as Wireshark which should be no surprise since they’re essentially the same product. This command tells TShark only to bother capturing the destination IP address as well as some other interesting fields from the HTTP part of the packet.
# tshark -i eth0 -Y http.request -T fields -e ip.dst -e http.user_agent -e http.request.uri

172.20.0.122    Mozilla/5.0 (X11; Linux x86_64; rv:57.0) Gecko/20100101 Firefox/57.0    /images/title.png
172.20.0.122    Mozilla/5.0 (X11; Linux x86_64; rv:57.0) Gecko/20100101 Firefox/57.0    /images/styles/phoenix.css
172.20.0.122    Mozilla/5.0 (X11; Linux x86_64; rv:57.0) Gecko/20100101 Firefox/57.0    /images/code/jquery_lightbox/jquery_lightbox/js/jquery-1.2.6.pack.js
172.20.0.122    Mozilla/5.0 (X11; Linux x86_64; rv:57.0) Gecko/20100101 Firefox/57.0    /images/styles/index.css
172.20.0.122    Mozilla/5.0 (X11; Linux x86_64; rv:57.0) Gecko/20100101 Firefox/57.0    /images/images/title.png
172.20.0.122    Mozilla/5.0 (X11; Linux x86_64; rv:57.0) Gecko/20100101 Firefox/57.0    /favicon.ico
172.20.0.122    Mozilla/5.0 (X11; Linux x86_64; rv:57.0) Gecko/20100101 Firefox/57.0    /favicon.ico
If you want to capture to a file you can use the -w switch to write it, and then use TShark’s -r (read mode) switch to read it.
Capture first:
# tshark -i eth0 -w tshark_packets
Capturing on 'eth0'
102 ^C
Read it, either on the same server, or transfer it to some other analysis server.
# tshark -r tshark_packets -Y http.request -T fields -e ip.dst -e http.user_agent -e http.request.uri
172.20.0.122    Mozilla/5.0 (X11; Linux x86_64; rv:57.0) Gecko/20100101 Firefox/57.0    /contact
172.20.0.122    Mozilla/5.0 (X11; Linux x86_64; rv:57.0) Gecko/20100101 Firefox/57.0    /reservations/
172.20.0.122    Mozilla/5.0 (X11; Linux x86_64; rv:57.0) Gecko/20100101 Firefox/57.0    /reservations/styles/styles.css
172.20.0.122    Mozilla/5.0 (X11; Linux x86_64; rv:57.0) Gecko/20100101 Firefox/57.0    /res/code/jquery_lightbox/jquery_lightbox/js/jquery-1.2.6.pack.js
172.20.0.122    Mozilla/5.0 (X11; Linux x86_64; rv:57.0) Gecko/20100101 Firefox/57.0    /res/styles/index.css
172.20.0.122    Mozilla/5.0 (X11; Linux x86_64; rv:57.0) Gecko/20100101 Firefox/57.0    /res/images/title.png
Who is it recommended for?
TShark is a good option for network specialists who have time to explore its features. If you are too busy with day-to-day tasks, you won’t really have time for TShark. The tool can be useful for quickly prototyping new applications that you want to develop. This tool is free to use and it is available for Windows, Unix, Linux, and macOS.
During our testing, we identified the following pros and cons related to TShark.
Pros:
- Easy Filtering: TShark offers easier and more flexible filtering options compared to similar tools. This precision is valuable for users who need specific information from network traffic.
- Operates Similarly to Wireshark: TShark operates similarly to Wireshark, making it easier for users who are familiar with Wireshark to transition to a command-line interface without a significant learning curve.
- Simplicity: TShark is more command-line interface-focused, making it a popular choice for users who prefer fewer graphical interfaces and a more streamlined, scriptable approach to network analysis.
Cons:
- Limited Built-In Analysis Tools: Users may need to rely on additional tools or scripts for in-depth analysis beyond basic packet capture.
- Not User/Beginner-Friendly: The learning curve may be steep for individuals who are not accustomed to command-line tools.
9. NetworkMiner
NetworkMiner is a fascinating tool that falls more into the category of a forensic tool rather than a straight-up network sniffer. The field of forensics typically deals with the investigation and collection of evidence and Network Miner does that job well for network traffic. Much like Wireshark can follow a TCP stream to recover an entire TCP conversation, Network Miner can follow a stream to reconstruct files that were sent over the network.
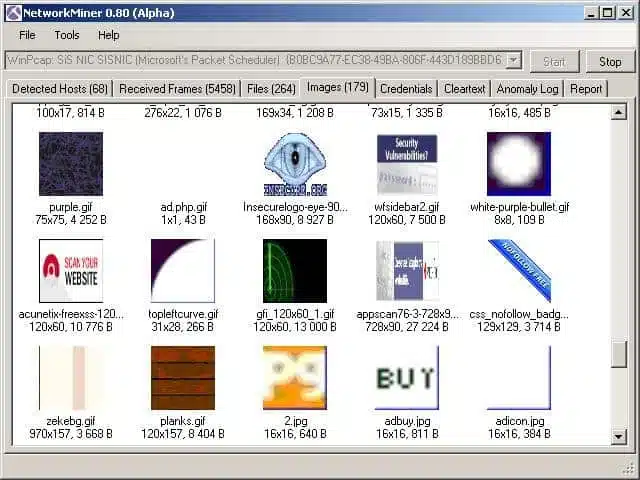
To capture live traffic, Network Miner should be strategically placed on the network to be able to observe and collect the traffic you’re interested in. It won’t introduce any of its own traffic onto the network, so it operates very stealthily.
When we tested NetworkMiner we found the following key features.
Key Features:
- Analysis Tool: NetworkMiner is designed as an analysis tool, focusing on extracting and presenting information from captured network traffic.
- Easy-to-Use Interface: This makes it accessible for users who prefer a more visual approach to network analysis.
- Forensic and Packet Sniffing Capabilities: Acts not only as a packet sniffer but also as a forensic tool, allowing users to analyze network traffic for investigative purposes.
- Free Version: NetworkMiner offers a free version that includes its basic features.
Why do we recommend it?
NetworkMiner should be considered as an alternative to Wireshark. The Wireshark system is great if you can remember all of the filtering commands. However, it can be time-consuming looking for the right keywords to use to make a proper analysis. NetworkMiner is easier to use because it has a simpler query language.
Network Miner can also operate in offline mode. You can use the tried and true tcpdump tool to capture packets at a point of interest on your network, and then import the pcap files into Network Miner. It will then attempt to reconstruct any files or certificates it finds in the capture file.
Network Miner is built for Windows, but by using Mono, it can be run on any OS that has a Mono framework such as Linux and macOS.
There’s a free version to get you started that has a decent array of features. If you want more advanced capabilities such as GeoIP location and custom scripting, you’ll need to purchase a professional license.
Who is it recommended for?
NetworkMiner is an option for people who just can’t deal with Wireshark. There is a free version of the system and a more powerful paid version. If you don’t like NetworkMiner either, you should focus on one of the NetFlow analyzer tools on this list. NetworkMiner runs on Windows and you can also get it on Linux or macOS through Mono.
During our testing, we identified the following pros and cons related to NetworkMiner.
Pros:
- TCP Stream Reconstruction: NetworkMiner can reconstruct files and packets over TCP streams, providing a detailed view of the communication between network entities.
- No Network Noise Introduction: Does not introduce any noise to the network during operation, making it suitable for forensic analysis and avoiding cross-contamination of network data.
- Free to Use: The basic version of NetworkMiner is free to use, and there is also a paid version available for users seeking more advanced features.
Cons:
- Antiquated Interface: The interface is considered quite outdated and can be difficult to navigate at times. This may impact the user experience, especially for those accustomed to more modern interfaces.
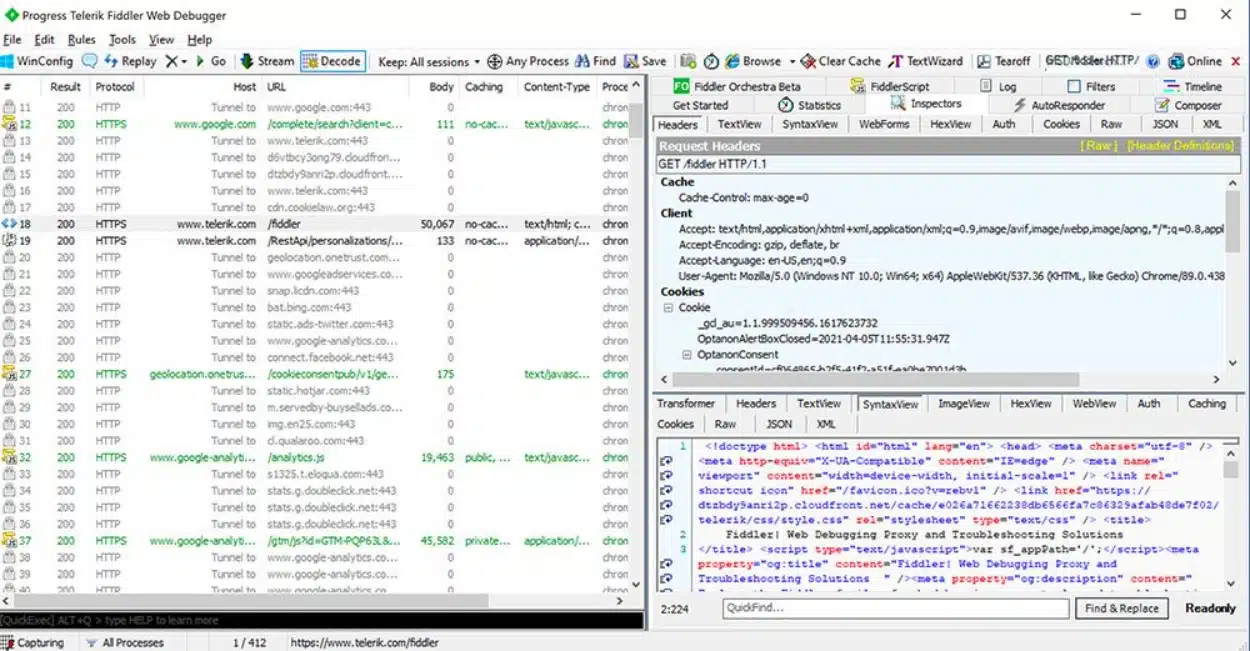
10. Fiddler (HTTP)
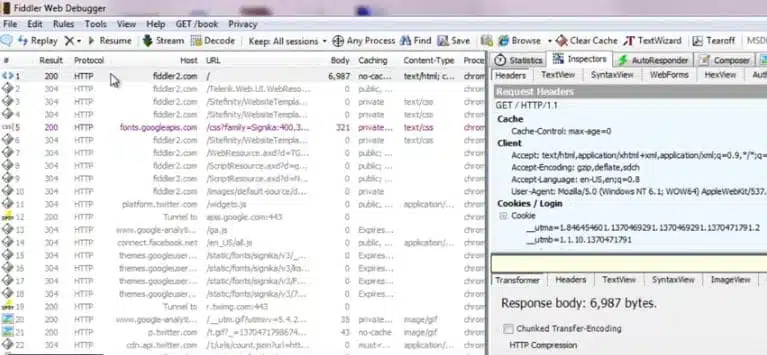
Fiddler is not technically a network packet capture tool, but it is so incredibly useful that it made the list. Unlike the other tools listed here which are designed to capture ad-hoc traffic on the network from any source, Fiddler is more of a desktop debugging tool. It captures HTTP traffic and while many browsers already have this capability in their developer tools, Fiddler is not limited to browser traffic. Fiddler can capture any HTTP traffic on the desktop including that of non-web applications.
Many desktop network applications use HTTP to connect to web services and without a tool like Fiddler, the only way to capture that traffic for analysis is using tools like tcpdump or WireShark. However, those tools operate at the packet level so analysis includes reconstruction of those packets into HTTP streams. That can be a lot of work to perform some simple HTTP investigation and Fiddler comes to the rescue. Fiddler can help discover cookies, certificates, and packet payload data coming in or out of those apps.
When we tested Fiddler we found the following key features.
Key Features:
- Displays HTTP Traffic: Fiddler is designed to display and capture HTTP traffic, providing insights into the communication between a client and a web server.
- Debugging Assistance: This helps users identify and troubleshoot issues related to HTTP communication.
- GUI Interface: This makes it more user-friendly for those who prefer visual tools over command-line interfaces.
Why do we recommend it?
Fiddler examines HTTP traffic and it has a similar appearance to Wireshark because it color codes captured packets in the data viewer. This system is specifically designed for analyzing Web traffic and it can be very advantageous for those developing Web applications to work out exactly what their new code is doing behind the scenes.
It helps that Fiddler is free and, much like NetworkMiner, it can be run within Mono on any other operating system with a Mono framework.
Who is it recommended for?
Fiddler is intended for use by Web application developers and the IT operations teams that received newly developed code. This is a good tool for use in DevOps environments and it is available in both free and paid versions. This system will run on Windows but you can get it on Linux and macOS through Mono.
During our testing, we identified the following pros and cons related to Fiddler.
Pros:
- Focus on Capturing HTTP Traffic: Fiddler is specifically focused on capturing HTTP traffic, providing a more specialized and less complex solution compared to tools with broader network analysis capabilities.
- Ideal for HTTP Security and Communication Analysis: Particularly suitable for users interested in examining the security and communication aspects of the HTTP protocol.
- Free to Use: Fiddler is entirely free to use, offering its features without the need for a paid version.
Cons:
- Steep Learning Curve: Fiddler is noted for having a steep learning curve, especially for users who are new to web debugging and proxy tools.
- Limited Support Availability: Users may find it challenging to locate support for specific issues related to Fiddler, as it may not have as extensive a support community as some other tools.
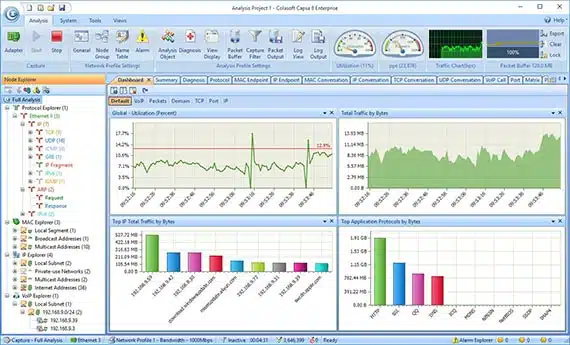
11. Capsa
Capsa Network Analyzer has several editions, each with varying capabilities. At the first level, Capsa free, the software essentially just captures packets and allows some very graphical analysis of them. The dashboard is very unique and can help novice sysadmins pinpoint network issues quickly even with little actual packet knowledge. The free level is aimed at people who want to know more about packets and build up their skills into full-fledged analysts.
The free version knows how to monitor over 300 protocols, it allows for email monitoring and also it can save email content and also supports triggers. The triggers can be used to set alerts for specific situations which means Capsa standard can also be used in a support capacity to some extent.
When we tested Capsa Network Analyzer we found the following key features.
Key Features:
- Analyzes 300 Protocols: Capsa supports the analysis of 300 different network protocols, allowing for comprehensive examination of network traffic.
- Interprets Data into Graphs: The tool interprets captured data into graphical representations, enhancing visualization for better understanding of network communication patterns.
- Built-in Traffic Analysis Tools and Graphs: Capsa includes built-in traffic analysis tools and graphical representations for live visualization, aiding in the real-time monitoring and analysis of network traffic.
- Intuitive Interface: Capsa features a more intuitive interface compared to similar tools, making it a user-friendly option, especially for junior sysadmins who may find it easier to learn.
Why do we recommend it?
Capsa Network Analyzer uses packet examination for protocol analysis and forms a live traffic monitor from these scans. You don’t need any specialist programming skills to use Capsa because it is driven by a GUI package. You can still filter traffic and adapt the display screens of the system.
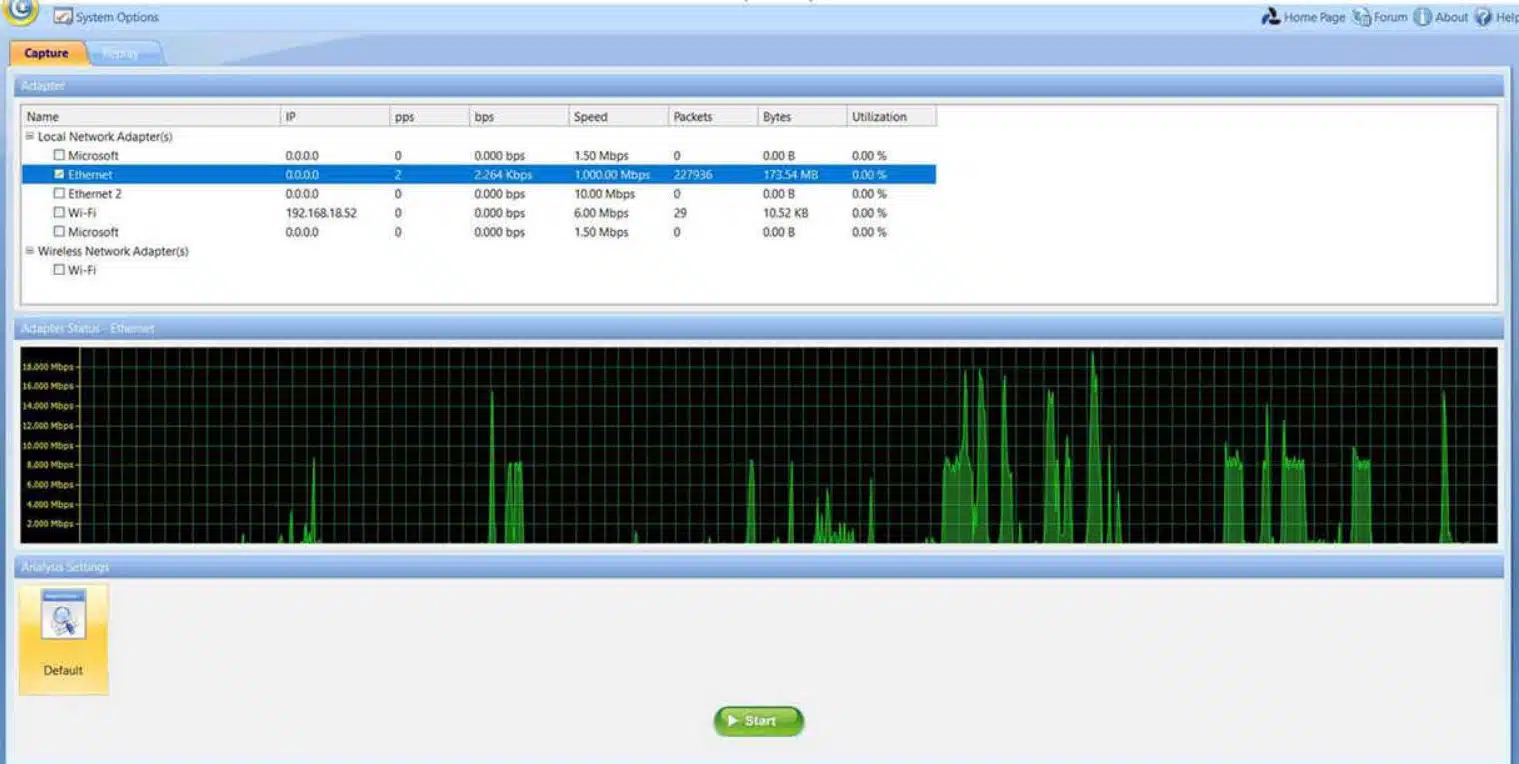
Capsa is only available for Windows 2008/Vista/7/8 and 10.
Who is it recommended for?
This is a good tool for small businesses that need a free network monitoring tool. There are higher editions that are paid and more comprehensive. This is a protocol analyzer that shows live graphs of traffic per application. Capsa offers a similar experience to the ManageEngine NetFlow Analyzer but it is a lot simpler.
During our testing, we identified the following pros and cons related to Capsa Network Analyzer.
Pros:
- Suitable for Junior Sysadmins: Due to its intuitive design, Capsa is considered a better option for junior sysadmins, offering a platform that is easier to learn and navigate.
- Free Version Supports Over 300 Protocols: The free version of Capsa supports a wide range of protocols, providing a robust set of features even in the absence of a paid subscription.
Cons:
- Not as Lightweight as CLI Tools: This may be a drawback for users looking for more resource-efficient options.
- Bulky Interface for Professionals: Professionals may find the interface of Capsa bulky and not as efficient, especially if they are accustomed to more streamlined or minimalist tools commonly found in CLI-based solutions.
Choosing a packet sniffer
With the packet sniffing tools I have mentioned, it is not a big leap to see how a systems administrator could build an on-demand network monitoring infrastructure.
If the network is so large that this isn’t feasible, then enterprise-level tools like the SolarWinds suite and its 30-day free trial can help tame all that network data into a manageable data set.
Tcpdump, or Windump, could be installed on all servers. A scheduler, such as cron or Windows scheduler, could kick off a packet collection session at some time of interest and write those collections to a pcap file.
At some later time, a sysadmin can transfer those packets to a central machine and use Wireshark to analyze them.
Advantages of packet sniffing
A packet sniffer is a useful tool to enable you to implement your company’s network capacity policy. The main benefits are that they:
Identify congested links
Identify applications that generate the most traffic
Collect data for predictive analysis
Highlight peaks and troughs in network demand
The actions you take depend on your available budget. If you have the resources to expand network capacity, the packet sniffer will enable you to target new resources more effectively. If you have no budget, packet sniffing will help traffic shaping through prioritizing application traffic, resizing subnets, rescheduling heavy-traffic events, limiting bandwidth for specific applications, or replacing applications with more efficient alternatives.
Promiscuous mode
It is important to understand how the network card on your computer operates when you install packet sniffing software. The interface from your computer to the network is called the “network interface controller,” or NIC. Your NIC will only pick up internet traffic that is addressed to its MAC address.
To capture general traffic, you need to put your NIC into “promiscuous mode”. This removes the listening limit on the NIC. In promiscuous mode, your NIC will pick up all network traffic. Most packet sniffers have a utility within the user interface that manages the mode switch for you.
Network traffic types
Network traffic analysis requires an understanding of how networking works. There’s no tool that will magically remove the requirement for an analyst to understand the basics of networking such as the TCP three-way handshake which is used to initiate a connection between two devices. Analysts should also have some understanding of the types of network traffic that exist on a normally functioning network such as ARP and DHCP traffic. This knowledge is essential because analyzing tools will just show you what you ask for – it’s up to you to know what to ask for. If you’re not sure how your network looks normally, it can be hard to ensure you’re digging for the right thing in the mass of packets you’ve collected.
Enterprise tools
Let’s start at the top and work our way down into the nitty-gritty basics. If you’re dealing with an enterprise-level network, you’ll need the big guns. While almost everything uses tcpdump at its core (more on that later), enterprise-level tools can provide other analytical functions. Such as correlating traffic from many servers, providing intelligent query tools to spot issues, alerting on exception cases, and producing nice graphs that management demands.
Enterprise-level tools tend to focus on network traffic flow rather than judging packet content. By that, I mean that the focus of most sysadmins in an enterprise is to keep the network humming along without performance bottlenecks. When bottlenecks occur, the goal is usually to determine if the problem is the network or an application on the network. On the other side of the coin, these enterprise-level tools are usually able to see so much traffic that they can help predict when a network segment will saturate which is a critical element of capacity management.
Hacker tools
Packet sniffers are also used by hackers. Be aware that these tools can be used to attack your network as well as to solve problems. Packet sniffers can be used as wiretappers to help steal data in transit. They can also contribute to man in the middle attacks that alter data in transit and divert traffic in order to defraud a user on the network. Invest in intrusion detection systems to protect your network from these forms of unauthorized access
How do Packet Sniffers and Network Analyzers work?
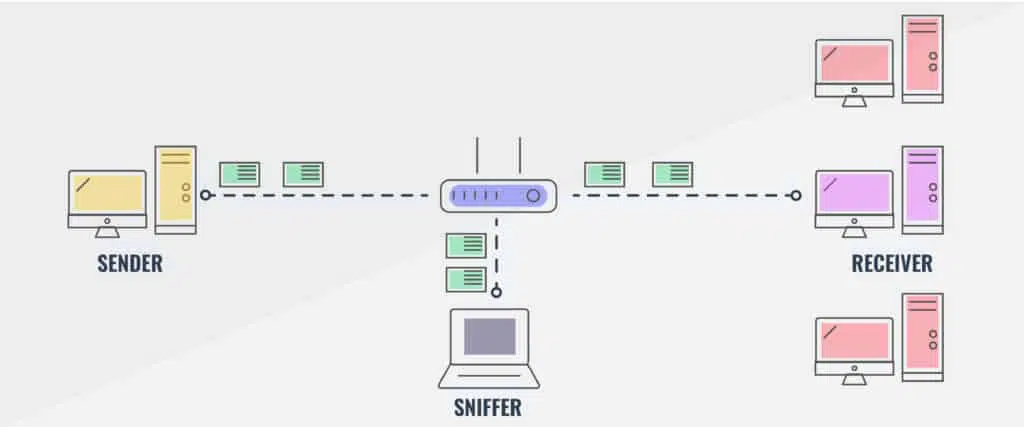
The key feature of a packet sniffer is that it copies data as it travels across a network and makes it available for viewing. The sniffing device simply copies all of the data that it sees passing over a network. When implemented on a switch, settings of the device allow the passing packet to be sent to a second port as well as the intended destination, thus duplicating traffic. Usually, the packets of data that are reaped from the network get copied to a file. Some tools will also show that data in a dashboard. However, packet sniffers can gather a lot of data, which includes encoded admin information. You will need to find an analysis tool that can help you dereference information on the journey of the packets in the extract and other pieces of information. Such as the relevance of the port numbers that the packets travel between.
A straightforward packet sniffer will copy over all of the packets traveling on the network. This can be a problem. If this is the case, the contents of the packet are not needed for network performance analysis. If you want to track network usage over a 24 hour period or over a few days, then storing every packet will occupy a very large amount of disk space — even if you are only taking in the packet headers. In these scenarios, it is advisable to sample packets, which means copying every 10th or 20th packet rather than copying over every single one.
Packet Sniffers FAQs
What do PCAP tools do?
PCAP is an abbreviation of “packet capture.” A PCAP tool copies packets as they travel around the network. The captured packets are displayed in a viewer within the tool, stored to a file, or both. Some PCAP tools will copy all of each packet, including its data payload, while others only display and/or store packet headers. PCAP tools that capture packets in their entirety create very large files and are stored with the .pcap extension.
What are the best network traffic analysis tools?
Our research shows that the best network traffic analysis tools are SolarWinds Deep Packet Inspection and Analysis Tool, Paessler Packet Capture Tool, ManageEngine NetFlow Analyzer, and the Omnipeek Network Protocol Analyzer. There are also some industry favorites such as tcpdump, Windump, and Wireshark.
How does a packet analyzer work?
A packet analyzer captures packets as they travel around the network. This can be implemented as a stand-alone packet capture device that works as a TAP or software that accesses the network adapter of its host computer in “promiscuous mode.” As well as copying network packets, a packet analyzer needs to offer a utility to view, search, and filter packet data. Some packet analyzers also include more sophisticated analysis tools.
Can packet sniffing be detected?
Packet sniffing can be detected in certain circumstances. The solution to finding packet capture depends on the location of the packet sniffer and the method it uses. A software packet sniffing tool requires that the host computer’s network adapter is in promiscuous mode. Issuing a Ping with the right IP address but the wrong MAC address for each computer on the network should spot the hosts that are in promiscuous mode and therefore likely to be in use for packet sniffing.
What is full packet capture?
Full packet capture copies all of a packet including the data payload. Typically full packet capture data gets stored in a file with the .pcap extension. Businesses don’t like network professionals using this method because the contents of the packet might not be encrypted. Allowing IT department staff to use full packet capture capabilities can break the confidentiality of data held by the enterprise and invalidate data security standards compliance.

)
You left out Savvius (Wild Packets) Omnipeek product.
Excellent article.